Traffic congestion and fuel wastage: APSC Current Affairs Notes and MCQs
APSC CCE current affairs notes on Traffic congestion and fuel wastage, from The Assam Tribune of 5 November 2026, with 4 practice MCQs for Prelims.
 For working professionals and full-time aspirantsAPSC CCE Foundation Programme₹24,999
Current Affairs Notes
From The Assam Tribune, 5 November 2026
Traffic Congestion and the Fuel Wastage Bill
Syllabus Mapping
- Prelims: GS Paper I (Current events of State/National importance; General issues on Environment and Ecology; Economic and Social Development).
- Mains: GS Paper III (Indian Economy: infrastructure, energy; Environment: pollution; Science and Technology: electric mobility); GS Paper V (Assam syllabus: urban issues and infrastructure in Assam).
Why in News? An opinion article by policy advisor Narendra Sarawgi in the Assam Tribune (5 November 2026) argues that traffic jams waste a large amount of fuel every year. He estimates the fuel loss at Rs 1.1-1.65 lakh crore and the wider cost at nearly Rs 10.4 lakh crore. He asks for a national mission on traffic efficiency.
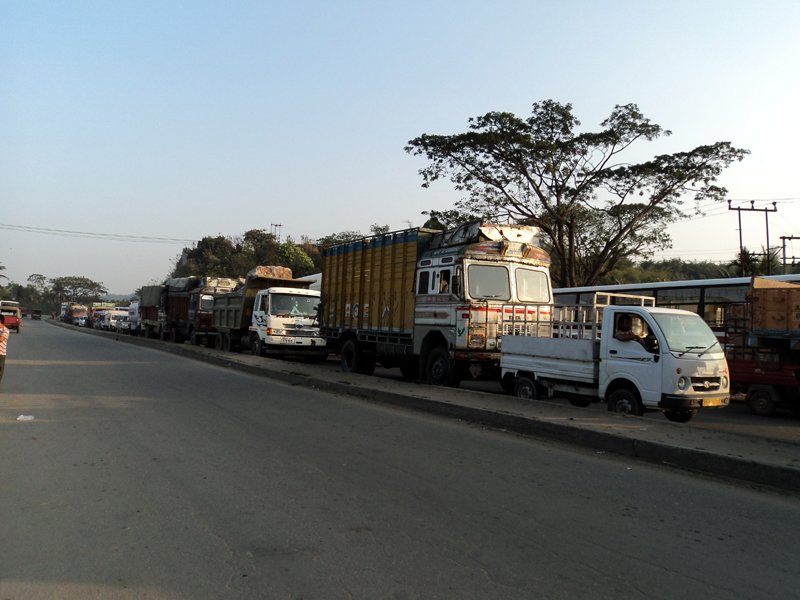
Current Context (The Trigger)
- Vehicle fleet: According to the writer, India had more than 41.5 crore registered vehicles by early 2026.
- Congestion ranking: The writer quotes the TomTom Traffic Index 2025. It places India fifth among the world’s most congested countries and second in Asia, with an average congestion level of 37.4 percent.
- City data: The writer says only Mexico City is more gridlocked than Bengaluru. Bengaluru commuters lose 168 hours a year to rush-hour traffic.
- Fuel waste estimate: The writer takes transport fuel use of about 141 billion litres in 2024-25. It covers 40 million tonnes of petrol and 73 million tonnes of diesel, citing PPAC. He assumes 8 to 12 percent is wasted in crawling and idling. That gives 11 to 17 billion litres a year, worth Rs 1.1-1.65 lakh crore.
- Wider cost: The writer uses a rule of thumb of about 3 percent of GDP, cited from a Centre for Science and Environment report. He arrives at nearly Rs 10.4 lakh crore and admits this is not a ground-up study.
- No official audit: The writer states that no official audit gives the national fuel or total bill. All these figures are his estimates.
Core Concepts & Static GK
- Traffic congestion: Congestion means traffic demand above road capacity, so speeds fall and journey times rise. Vehicles then burn fuel while moving slowly or standing still.
- Idling loss: An engine that is on but not moving uses fuel for zero output. The writer cites CSIR-CRRI (Central Road Research Institute) idling data. A two-wheeler uses about 0.14 litres an hour. A three-wheeler uses 0.24, a car about 0.6 and a bus close to 0.9.
- Bundled cost versus fuel cost: The Boston Consulting Group (BCG) figure of Rs 1.47 lakh crore for four metros is a bundled cost. It adds up fuel, lost time and productivity, pollution and accidents. The writer says fuel alone would be about Rs 25,000 to Rs 40,000 crore.
- Oil import dependence: India buys most of its crude oil from abroad. Petroleum Planning and Analysis Cell (PPAC) data for 2024-25 show import dependence of 88.2 per cent and a crude import bill of about $137 billion.
- Congestion pricing: This is a charge on vehicles entering a busy zone at peak hours. London began central-zone charging on 17 February 2003 with a daily fee of 5 pounds.
- Energy security: It means reliable and affordable energy supply. The writer argues that lower avoidable fuel use reduces the import bill and the exposure to oil-price shocks.
Institutional Machinery
- PPAC: The Petroleum Planning and Analysis Cell works under the Oil Ministry. It publishes data on petroleum consumption, production and imports.
- Ministry of Heavy Industries: It runs the PM E-DRIVE scheme for electric vehicles.
- Ministry of Housing and Urban Affairs (MoHUA): It ran the Smart Cities Mission. Its predecessor, the Ministry of Urban Development, framed the National Urban Transport Policy.
- Road Transport Ministry: The writer says it has a newer Rs 2 lakh crore plan to build 10,000 km of ring roads and bypasses in 500 cities.
Schemes & Initiatives
- National Urban Transport Policy (NUTP), 2006: The Union Cabinet approved it in April 2006. It aims at safe, affordable, quick, comfortable, reliable and sustainable urban transport, with people rather than vehicles as the focus.
- Unified Metropolitan Transport Authority (UMTA): NUTP recommends one coordinating body for cities with a population of ten lakh or more.
- PM E-DRIVE: The Union Cabinet approved it in September 2024 with an outlay of Rs 10,900 crore. It supports electric two-wheelers, three-wheelers, e-buses and charging points, and it replaced the FAME scheme. A 2025 notification extended it to 31 March 2028 within the same outlay.
- Smart Cities Mission: The Prime Minister launched it on 25 June 2015 for 100 cities. Its deadline was extended to 31 March 2025.
Reports, Indices & Data
- TomTom Traffic Index 2025: The writer uses it for India’s rank (fifth most congested country) and the congestion level of 37.4 percent.
- BCG study for Uber, 2018: It put the yearly cost of congestion in Delhi, Mumbai, Bengaluru and Kolkata at roughly Rs 1.47 lakh crore. Peak-hour congestion averaged 149 percent, so a rush-hour trip took 2.5 times longer than the same trip on a clear road.
- Economic Survey 2025-26: The writer says it flagged congestion pricing and parking reform.
- PPAC, 2024-25: Crude import dependence rose to 88.2 per cent and the crude import bill rose 2.7 per cent to about $137 billion.
Assam & Northeast Linkages
- Op-ed has no Assam data: The article gives national and metro figures only. The Guwahati points below come from separate sources.
- Vehicle mix in Guwahati: An IIT Guwahati study submitted in March 2025 found that two-wheelers make up 50% of registered vehicles and petrol four-wheelers 27%.
- Slow traffic: A 2016 Ministry of Urban Development document recorded an average traffic speed of 20 km/h in Guwahati.
- Public buses: The Assam State Transport Corporation (ASTC) runs 256 electric and 100 CNG buses in the city. An ASTC official put ridership at about 100,000 passengers on a working day.
- Air quality: The IQAir World Air Quality Report 2023 ranked Guwahati the world’s second most polluted city, after Begusarai. In the IIT Guwahati study, two-wheelers produced 52% of the city’s PM2.5 emissions.
Prelims Trap Zones (Watch out for)
- Bundled figure trap: Rs 1.47 lakh crore is the BCG estimate for four metros and covers fuel, time, pollution and accidents. It is not a fuel bill. The writer puts the fuel part at Rs 25,000 to Rs 40,000 crore.
- Four-metro trap: The BCG study covers Delhi, Mumbai, Bengaluru and Kolkata. Chennai is not among them. It was done in 2018 for Uber.
- Estimate trap: The Rs 1.1-1.65 lakh crore fuel loss and the Rs 10.4 lakh crore total are the writer’s estimates. They are not official government figures.
- Import dependence trap: The op-ed writer says India imports “close to 89 per cent” of its crude. Official PPAC data give 88.2 per cent for 2024-25. Always match a figure with its source and year.
- Ministry trap: PM E-DRIVE is a Ministry of Heavy Industries scheme. It is not run by the Road Transport Ministry or MoHUA.
- Population trap: NUTP 2006 recommends UMTAs for cities of ten lakh or more, not one lakh.
Introduction
A writer in the Assam Tribune on 5 November 2026 estimates that India burns 11 to 17 billion litres of fuel a year in jams. This fuel is worth Rs 1.1-1.65 lakh crore. This is costly because India imports most of its crude oil, so every wasted litre adds to the import bill and to exposure to oil-price shocks. Cities like Guwahati, where speeds are low and two-wheelers dominate, face the same problem.
Scale and Cost of Congestion
- Large fleet: The writer says India’s registered vehicles passed 41.5 crore by early 2026. When vehicle numbers grow faster than road space, jams spread across cities.
- Time lost: The writer says Bengaluru commuters lose 168 hours a year in rush-hour traffic. That is nearly a working week of lost work and rest.
- Metro cost: The 2018 BCG study estimated a yearly loss of roughly Rs 1.47 lakh crore in four metros. A 2023 study, as the writer cites it, put Bengaluru’s own loss at nearly Rs 20,000 crore.
- Fuel burnt for nothing: The writer assumes 8 to 12 percent of 141 billion litres is wasted. He says a former Delhi official separately estimated that metro cities waste about 10 percent of their fuel.
- Total cost: At about 3 percent of the Rs 346.36 lakh crore nominal GDP for 2025-26, the writer reaches nearly Rs 10.4 lakh crore. Fuel is then about an eighth of the total, which matches the four-city pattern.
- Caution on estimates: The writer himself calls the 3 percent figure a rule of thumb and notes that no official audit exists. Students should present these numbers as estimates.
Impact on Energy Security, Health and Equity
- Import pressure: PPAC data show India paid about $137 billion for crude imports in 2024-25. Avoidable fuel use adds to this bill and drains foreign exchange.
- Price shocks: A country that imports most of its crude feels global price rises quickly. Cutting waste is one of the few steps that works at once and needs no new supply.
- Costlier goods: Diesel trucks and buses waste the most expensive fuel. The writer says this raises the delivered cost of food and medicines.
- Health cost: Idling engines burn fuel incompletely and emit more PM2.5 and nitrogen oxides (NOx). This worsens winter smog and breathing illness.
- Vehicle type matters: CSIR-CRRI idling data show a bus burns about 0.9 litres an hour against 0.14 for a two-wheeler. Millions of vehicles idling at signals add up quickly.
- Opportunity cost: The writer notes that the fuel-only estimate of around Rs 1.38 lakh crore is close to the Rs 1.39 lakh crore education budget for 2026-27. The money could fund schools and clinics instead.
Government & Statutory Measures
| Level | Initiative | Purpose & Impact |
|---|---|---|
| National | National Urban Transport Policy, 2006 | Sets the aim of safe, affordable and sustainable urban transport. It recommends UMTAs in cities of ten lakh or more. Its impact is limited because many cities have not set up strong UMTAs. |
| National | Smart Cities Mission (launched 25 June 2015) | Funded area-based and pan-city projects in 100 cities, including mobility works. Its deadline was extended to 31 March 2025. |
| National | PM E-DRIVE (outlay Rs 10,900 crore) | Supports electric two-wheelers, three-wheelers and e-buses with charging points. It cuts fuel use and tailpipe pollution. |
| National | Economic Survey 2025-26 advice (as the writer reports) | Flags congestion pricing and parking reform as tools to ease traffic without building new roads. |
| National | Rs 2 lakh crore ring road and bypass plan (as the writer reports) | Aims at 10,000 km of ring roads and bypasses in 500 cities to take through traffic out of city centres. |
| Assam | ASTC electric and CNG city buses in Guwahati | 256 electric and 100 CNG buses carry about 100,000 passengers on a working day, as per an ASTC official. This reduces private vehicle use. |
Challenges
- No reliable national audit: The writer says no official audit gives the fuel or total cost of congestion. Without such data, policies rest on rough estimates and are hard to target.
- Car-based growth: Critics say NUTP’s aim of putting people, not vehicles, first has not been met. In Guwahati, two-wheelers are 50% of registered vehicles while public transport use has barely changed.
- Weak coordination: Many agencies handle roads, buses, parking and signals separately. UMTAs were meant to join them but exist in only some cities.
- Slow, costly construction: Ring roads and expressways take years and heavy funds. The writer notes that cheaper fixes like synchronised signals and bus lanes act faster.
- Battery import risk: The writer warns that more electric vehicles mean bigger bills for imported batteries. India needs large-scale battery manufacturing at home.
- Public acceptance: Congestion charges need good bus services first. Without them, commuters see the charge as a burden, not a choice.
Way Ahead
- Official fuel audit: The Oil Ministry, PPAC and the Road Transport Ministry should jointly measure fuel lost to idling. A sound national number would let policy target the worst corridors.
- Congestion pricing and parking reform: Large cities should test peak-hour charges and priced parking, as the Economic Survey 2025-26 flagged. Transport for London reported that traffic delays in its charging zone stayed about 30 percent lower after the first year.
- Smart signals: City traffic police should synchronise signals and use adaptive control, as Seoul has done according to the writer. This keeps traffic moving without new concrete.
- Strong public transport: MoHUA and state governments should add buses and bus lanes, because a single full bus can remove up to 40 private cars, the writer says. Guwahati’s ASTC fleet can be scaled up.
- Empower UMTAs: Million-plus cities, including Guwahati, should set up UMTAs with real powers over routes, fares and parking, as NUTP 2006 intended.
- Faster EV shift with local batteries: The Ministry of Heavy Industries should link PM E-DRIVE support to domestic battery production. This way, cleaner transport does not create a new import problem.
- Switch-off campaigns: Traffic departments can run “engine off at red lights” drives. The writer calls such steps cheap ways to cut idling losses without years of construction.
Conclusion
The exact size of the fuel bill is uncertain, since the figures are the writer’s estimates and not an official audit. Even so, the direction is clear: wasted fuel deepens India’s oil import problem and harms health. A mix of better data, priced road space, strong public transport and domestic battery capacity offers the surest way to save fuel in cities such as Guwahati.
APSC Prelims MCQs
Practice questions on this topic
Q1. A newspaper opinion article estimates the national cost of traffic congestion. Consider the following statements:
(i) The writer assumes that 8 to 12 percent of transport-sector fuel is wasted while vehicles crawl or idle in traffic.
(ii) The Rs 1.47 lakh crore figure of the Boston Consulting Group study for four metros is the cost of wasted fuel alone.
(iii) The writer applies a rule of thumb of about 3 percent of GDP to reach a total cost of nearly Rs 10.4 lakh crore.
Which of the statements given above is/are correct?
- (a) (i) and (ii) only
- (b) (i) and (iii) only
- (c) (ii) and (iii) only
- (d) (i), (ii) and (iii)
Show answer
Answer: (b) Explanation: Statements (i) and (iii) are correct. The writer assumes 8 to 12 percent of transport fuel is wasted in idling, giving 11 to 17 billion litres a year. He also applies a rule of thumb of about 3 percent of GDP to Rs 346.36 lakh crore of nominal GDP for 2025-26, giving nearly Rs 10.4 lakh crore. Statement (ii) is wrong because the Rs 1.47 lakh crore figure is a bundled cost covering fuel, lost productivity, pollution and accidents. The writer puts the fuel part at only Rs 25,000 to Rs 40,000 crore. Value addition: the Boston Consulting Group study was done in 2018 for Uber and covered Delhi, Mumbai, Bengaluru and Kolkata.
Q2. Arrange the following in chronological order, from the earliest to the latest:
(i) Launch of the Smart Cities Mission
(ii) Introduction of central London congestion charging
(iii) Approval of the PM E-DRIVE scheme by the Union Cabinet
(iv) Approval of the National Urban Transport Policy by the Union Cabinet
Select the correct answer using the codes given below:
- (a) (ii), (iv), (i), (iii)
- (b) (iv), (ii), (i), (iii)
- (c) (ii), (iv), (iii), (i)
- (d) (iv), (i), (ii), (iii)
Show answer
Answer: (a) Explanation: The correct order is London congestion charging (17 February 2003), the National Urban Transport Policy (April 2006), the Smart Cities Mission (25 June 2015) and PM E-DRIVE (September 2024). So the sequence is (ii), (iv), (i), (iii). Option (b) wrongly places the national policy before London’s charge. Option (c) puts PM E-DRIVE before the Smart Cities Mission, though the mission is nine years older. Option (d) places the Smart Cities Mission ahead of London’s 2003 charge, which is wrong. Value addition: PM E-DRIVE replaced the FAME scheme, carries an outlay of Rs 10,900 crore and now runs till 31 March 2028.
Q3. Which Union Ministry implements the PM E-DRIVE scheme that supports electric buses, two-wheelers and charging infrastructure?
- (a) Ministry of Road Transport and Highways
- (b) Ministry of Heavy Industries
- (c) Ministry of Housing and Urban Affairs
- (d) Ministry of New and Renewable Energy
Show answer
Answer: (b) Explanation: PM E-DRIVE (Prime Minister Electric Drive Revolution in Innovative Vehicle Enhancement) is a scheme of the Ministry of Heavy Industries. The Union Cabinet approved it in September 2024 with an outlay of Rs 10,900 crore. It supports e-two-wheelers, e-three-wheelers, e-buses and charging points, and it replaced the FAME scheme. The Road Transport Ministry (a) frames vehicle and road rules but does not run this subsidy. MoHUA (c) runs urban missions such as the Smart Cities Mission. The Ministry of New and Renewable Energy (d) deals with renewable power. Value addition: the scheme provides funds for 14,028 e-buses for public transport agencies.
Q4. The National Urban Transport Policy, 2006 recommends the creation of a Unified Metropolitan Transport Authority (UMTA) in cities with a population of:
- (a) one lakh or more
- (b) five lakh or more
- (c) ten lakh or more
- (d) twenty lakh or more
Show answer
Answer: (c) Explanation: The National Urban Transport Policy, 2006 recommends a Unified Metropolitan Transport Authority in cities of ten lakh or more, commonly called million-plus cities. The authority is meant to coordinate roads, buses, metro, parking and traffic planning under one body. Options (a) and (b) set the threshold too low, which would cover many small towns that do not need such a body. Option (d) sets it too high and would leave out several million-plus cities. Value addition: the policy aims at safe, affordable, quick, comfortable, reliable and sustainable urban transport. UMTA creation was one of the reform conditions linked to bus funding under JNNURM.
Prepare with SuchitraACS
APSC CCE Foundation Programme₹24,999  APSC Prelims Crash Course 2027 (GS + CSAT)₹5,999
 APSC Prelims PYQ Book 2020-2025 (PDF)₹199See the book